Simulating the propagation of a virus in the city of Bozen-Bolzano
Virus contagion among a population typically follows an exponential growth. One single infected person will infect 2 (making 3 infected), each of them will infect 2 (making 7 infected), each of them will infect 2 (making 15 infected), and so on. After 10 steps of contagion, 1,000 persons will be infected. After 15 steps of contagion, 30,000 persons will be infected.
In the event of a pandemic, healthcare systems of a region may be confronted to a influx of patients so great that they find themselves at the brink of collapse. Social distancing is a measure of infection control whose aim is to slow down the spread of a disease ("flatten the curve"), or stop it altogether.
On March 14, 2020, amidst the pandemic of COVID-19, The Washington Post published Why outbreaks like coronavirus spread exponentially, and how to "flatten the curve". It shows several simulations of the propagation of a "fake" virus in a population. The population can move freely in an abstract square area, and the individuals bump into each other. If a sick individual bumps into a healthy individual, the latter will become sick.
We do a similar series of simulations with a "new strain" of the "fake" virus. The main difference is that the population is not moving in an abstract world, but in an actual city, here, the city of Bozen-Bolzano, in the South Tyrol. We start with 300 individuals. 10% of the population is initially infected. When a person is respecting social distancing, they move around only within one cadastral parcel. When a person does not respect social distancing it moves around the city using the main streets. The probability of infection when getting in contact with a sick person is "only" 0.25.
The effect of social distancing
We run three simulations: when 10% of the population is respecting social distancing, when 60% does, and when 90% does. In the charts, time is fictitious.
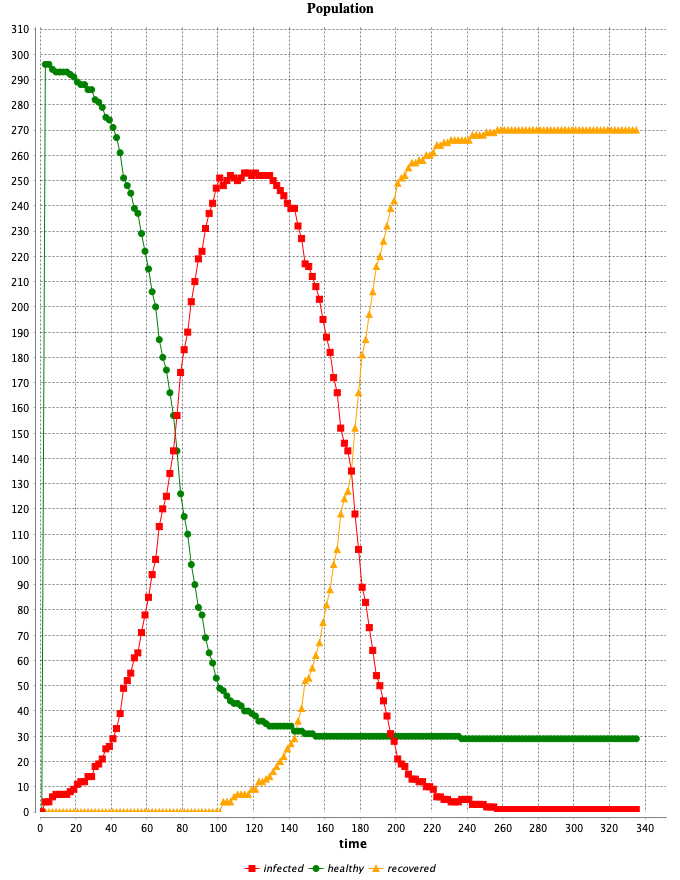
Social distancing 10%
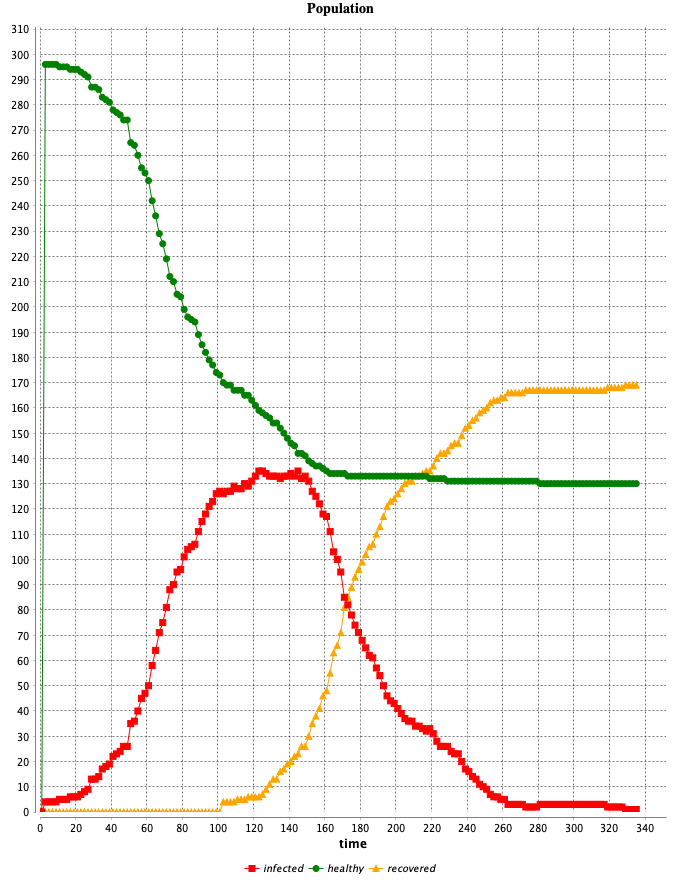
Social distancing 60%

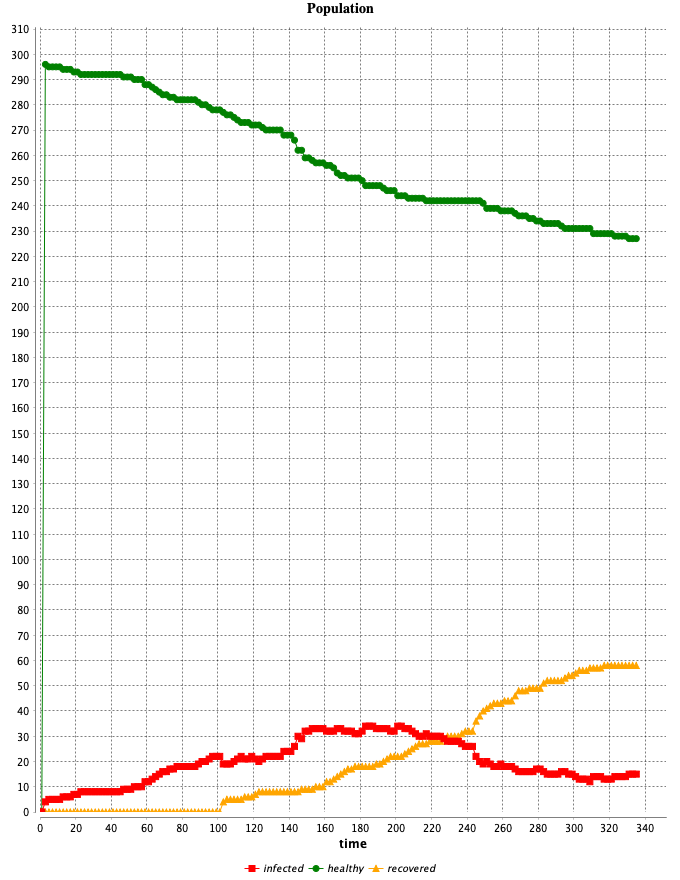
Social distancing 90%

Results
With 10% of the population respecting social distancing, this strain of "fake" virus has contaminated 90% of the population. With 60% of the population respecting social distancing, this number is about 55%. With 90% of the population respecting social distancing, it drops to about 20%, and the peak of contagion comes much later.
Method and resources
The simulations are made using the platform GAMA. The geographical data was obtained from the geocatalogo of the Rete Civica dell'Alto Adige (il portale della Pubblica Amministrazione). Download the GAMA model, and the resources, or use git.